
Question 1
A car is approaching traffic lights. The driver brakes so that the car's velocity decreases from 22 m.s-1 to 7 m.s-1 in a time of 10 s.
a. Sketch a velocity-time graph to represent this section of the car's journey.
b. Calculate the car's acceleration.
c. State how the graph shows that the car is decelerating. Remember that 'decelerating' means that the car's velocity is decreasing; its acceleration is negative.
d. On your graph, shade the area which represents the car's displacement as it is braking.
e. Calculate the displacement of the car.
Easy
Mark as Complete
Mark Scheme
Question 2
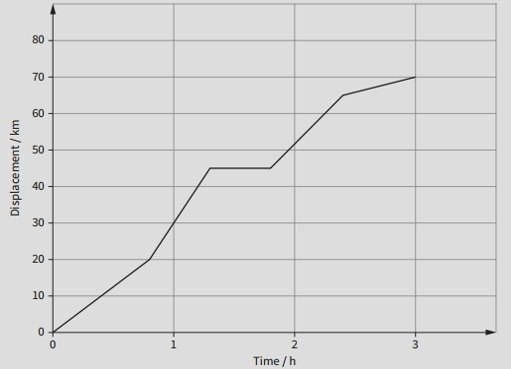
From the graph, deduce the following:
a. The time taken for the car's journey.
b. The distance travelled by the car during its journey.
c. The car's average speed during its journey.
d. The car's greatest speed during its journey.
e. The amount of time the car spent travelling at the speed you calculated in d.
f. The distance it travelled at this speed.
Easy
Mark as Complete
Mark Scheme
Question 3
Define speed and velocity and distinguish between those two quantities.
Easy
Mark as Complete
Mark Scheme
Question 4
A car travels due north at a constant speed of 30 m.s−1 for 2.0 minutes. The car then travels due east at a constant speed of 20 m.s−1 for four minutes. What is the total distance travelled by the car?
A. 140 m.
B. 8400 m.
C. 9000 m.
D. 9100 m.
Easy
Mark as Complete
Mark Scheme
Question 5
A hot-air balloon rises vertically. At time t = 0, a ball is released from the balloon. this graph shows the variation of the ball's velocity v with t. The ball hits the ground at t = 4.1 s.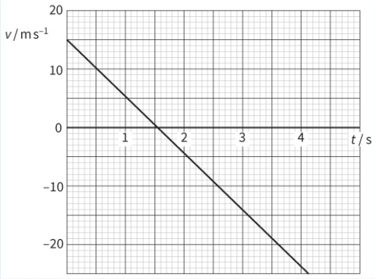
a. Explain how the graph shows that the acceleration of the ball is constant.
b. Use the graph to:
i. Determine the time at which the ball reaches its highest point.
ii. Show that the ball rises for a further 12 m between release and its highest point.
iii. Determine the distance between the highest point reached by the ball and the ground.
c. The equation relating v and t is v = 15 - 9.81t. State the significance in the equation of:
i. The number of 15.
ii. The negative sign.
Medium
Mark as Complete
Mark Scheme
Question 6
The variation with time t of the velocity v of two cars P and Q is shown in figure below.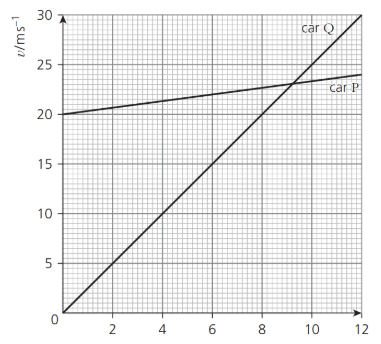 The cars travel in the same direction along a straight road. Car P passes car Q at time t = 0.
a. The speed limit for cars on the road is 100 km.h-1. State and explain whether car Q exceeds the speed limit.
b. Calculate the acceleration of car P.
c. Determine the distance between the two cars at time t = 12 s.
Medium
Mark as Complete
Mark Scheme
Question 7
A car of mass 1500 kg travels along a straight horizontal road.
The variation with time t of the displacement x of the car is shown figure below.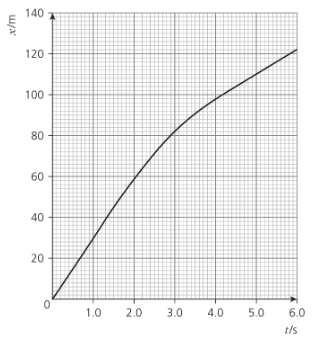 a. Calculate the average velocity during the time interval t = 0 to t = 1.5 s.
b. Show that the average acceleration between t = 1.5 s and t = 4.0 s is −7.2 m.s−2.
Medium
Mark as Complete
Mark Scheme
Question 8
An aircraft flies 30 km due east and then 50 km north-east (figure below). Calculate the final displacement of the aircraft. 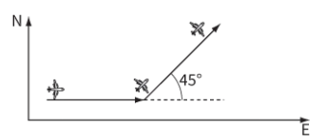
Medium
Mark as Complete
Mark Scheme
Question 9
A ball is thrown vertically upwards with an initial speed of 20 m.s−1 from a platform 15 m above the ground. The ball travels to a maximum height and then returns to ground level. How long does the ball take to travel from the platform to its maximum height and then to the ground?
A. 2.7 s.
B. 4.1 s.
C. 4.7 s.
D. 5.3 s.
Medium
Mark as Complete
Mark Scheme
Question 10
A ball is thrown at an angle to the horizontal of 30° with an initial speed of 45 m.s−1. What time does the ball take to return to the same horizontal level as its release point?
A. 2.3 s.
B. 4.0 s.
C. 4.6 s.
D. 8.0 s.
Medium
Mark as Complete
Mark Scheme
Question 1
A car is approaching traffic lights. The driver brakes so that the car's velocity decreases from 22 m.s-1 to 7 m.s-1 in a time of 10 s.
a. Sketch a velocity-time graph to represent this section of the car's journey.
b. Calculate the car's acceleration.
c. State how the graph shows that the car is decelerating. Remember that 'decelerating' means that the car's velocity is decreasing; its acceleration is negative.
d. On your graph, shade the area which represents the car's displacement as it is braking.
e. Calculate the displacement of the car.
a.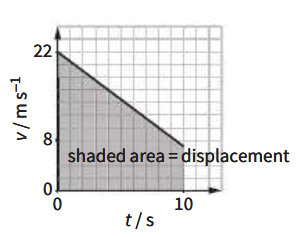
b. `"acceleration" = "change in velocity" / "time taken" = (7" m"."s"^-1 - 22 " m"."s"^-1)/"10 s" = -1.5 " m"."s"^-2``
c. In a velocity-time graph, a downward slope indicates a decrease in velocity. Since it goes from 22 m.s-1 to 7 m.s-1, the car is decelerating.
d. Displacement is found from the area under the velocity-time graph. This area is a trapezium.
e. `"displacement"= 1/2(22+7) xx 10 = "145 m"`
Question 2
From the graph, deduce the following:
a. The time taken for the car's journey.
b. The distance travelled by the car during its journey.
c. The car's average speed during its journey.
d. The car's greatest speed during its journey.
e. The amount of time the car spent travelling at the speed you calculated in d.
f. The distance it travelled at this speed.
a. 3 hours.
The graph shows the car moving from 0 to 3 hours on the x-axis.
b. 70 km.
The car starts at 0 km and ends at 70 km on the y-axis.
c. `"Average speed" = "distance" / "time taken" = "70 km" / "3 h" = 23.3 " km"."h"^-1`.
d. From 1 h to 1.5 h, the car moves from 25 km to 50 km.
`"average speed" = "distance" / "time taken" = "25 km" / "0.5 h" = 50 " km"."h"^-1`.
e. The car moved at 50 km/h from 1 h to 1.5 h, which is 0.5 hours.
f. `"distance" = "speed" xx "time taken" = 50 " km"."h"\^-1 xx "0.5 h" = "25 km"` .
Question 3
Define speed and velocity and distinguish between those two quantities.
Definition of speed: Distance travelled per a unit of time.
Definition of velocity: Displacement of object per a unit of time.
Distinguish speed and velocity: Speed has no direction, while velocity includes both magnitude and direction.
Question 4
A car travels due north at a constant speed of 30 m.s−1 for 2.0 minutes. The car then travels due east at a constant speed of 20 m.s−1 for four minutes. What is the total distance travelled by the car?
A. 140 m.
B. 8400 m.
C. 9000 m.
D. 9100 m.
Answer: B
The total distance travelled by the car is:
`s=s_1 + s_2 = v_1xxt_1+v_2xxt_2`
`=30 " m"."s"^-1 xx (2xx60)"s"+20" m"."s"^-1 xx (4xx60)"s"="8400 m"`
Question 5
A hot-air balloon rises vertically. At time t = 0, a ball is released from the balloon. this graph shows the variation of the ball's velocity v with t. The ball hits the ground at t = 4.1 s.
a. Explain how the graph shows that the acceleration of the ball is constant.
b. Use the graph to:
i. Determine the time at which the ball reaches its highest point.
ii. Show that the ball rises for a further 12 m between release and its highest point.
iii. Determine the distance between the highest point reached by the ball and the ground.
c. The equation relating v and t is v = 15 - 9.81t. State the significance in the equation of:
i. The number of 15.
ii. The negative sign.
a. The graph of velocity vs time is a straight line, which means the velocity changes at a constant rate. Therefore, the acceleration (slope) is constant.
b.
i. The highest point is when velocity = 0 (the ball stops rising before falling).
From the graph, this occurs at around t = 1.55 s.
ii. We calculate the area under the graph from t = 0 to t = 1.55 s
`"displacement" = 1/2 xx 15 xx 1.55 = "11.6 m"`
iii. We calculate the area under the graph from t = 1.55 to t = 4.1 s
`"displacement" = 1/2 xx (0 - 25) xx (4.1 - 1.55) = "31.8 m"`
c.
i. When t = 0, v = 15 m.s-1. So this is the initial upward velocity of the ball when released from the rising balloon.
ii. The acceleration is in the opposite direction to the initial speed of the ball. or
The acceleration due to gravity is downwards and the ball initially rises.
Question 6
The variation with time t of the velocity v of two cars P and Q is shown in figure below.The cars travel in the same direction along a straight road. Car P passes car Q at time t = 0.
a. The speed limit for cars on the road is 100 km.h-1. State and explain whether car Q exceeds the speed limit.
b. Calculate the acceleration of car P.
c. Determine the distance between the two cars at time t = 12 s.
a. The speed of car Q is 30 m.s-1 = 108 km.h-1 (convert from m.s-1 to km.h-1 by multiplying by 3.6).
Since 108 km.h-1 > 100 km.h-1. Therefore, car Q exceeds the speed limit.
b.`"Acceleration" = "change in velocity"/ "time taken"`
`= (24 " m"."s"^-1 - 20 " m"."s"^-1)/"12 s" = 0.33 " m"."s"^-2`
c. Distance travelled = area under the graph (only use for velocity-time graph).
Car Q travels: `1/2xx30xx12="180 m"`.
Car P travels: `1/2xx(20+24)xx12="264 m"`.
The distance between 2 cars: `"264 m" - "180 m"="84 m"`.
Question 7
A car of mass 1500 kg travels along a straight horizontal road.
The variation with time t of the displacement x of the car is shown figure below.a. Calculate the average velocity during the time interval t = 0 to t = 1.5 s.
b. Show that the average acceleration between t = 1.5 s and t = 4.0 s is −7.2 m.s−2.
a. `"Average velocity" = "45 m"/"1.5 s" = 30" m"."s"^-1`
b. Velocity at t = 4 s:
`("122 m" - "98 m")/"2 s"= 12" m"."s"^-1`.
Acceleration between t = 1.5 s and t = 4 s:
`(12" m"."s"^-1-30" m"."s"^-1)/"2.5 s"=-7.2" m"."s"^-2`
Question 8
An aircraft flies 30 km due east and then 50 km north-east (figure below). Calculate the final displacement of the aircraft.
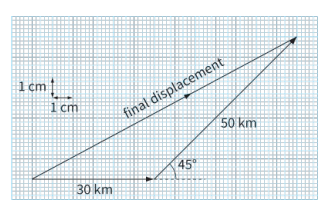 The angle between the 30 km line and the 50 km line is: `180^o-45^o=135^o`
Using cosin rule to determine the final displacement:
`"Final displacement"=sqrt(30^2+50^2-2xx30xx50xxcos135^o)="74.3 km"`
The angle of the final displacement vector:
`theta=cos^-1((74.3^2+30^2-50^2)/(2xx74.3xx30))=28.4^o`
Therefore, the aircraft’s final displacement is 74 km at 28.4° north of east.
Question 9
A ball is thrown vertically upwards with an initial speed of 20 m.s−1 from a platform 15 m above the ground. The ball travels to a maximum height and then returns to ground level. How long does the ball take to travel from the platform to its maximum height and then to the ground?
A. 2.7 s.
B. 4.1 s.
C. 4.7 s.
D. 5.3 s.
Answer: C
Consider upward as the positive direction.
Using equation of motion:
`s=ut+1/2at^2`.
`-15=20xxt-1/2xx9.81xxt^2`.
`t_1=4.73 " s" and t_2 = -0.65 " s"`
We discard t2 since time cannot be negative.
Question 10
A ball is thrown at an angle to the horizontal of 30° with an initial speed of 45 m.s−1. What time does the ball take to return to the same horizontal level as its release point?
A. 2.3 s.
B. 4.0 s.
C. 4.6 s.
D. 8.0 s.
Answer: C
The vertical component of speed:
`v_(O_y)=v_o xxsintheta= 45xxsin30^o=22.5" m"."s"^-1`.
Time taken to reach the maximum height:
`t_(up)=v_(O_y)/g=(22.5" m"."s"^-1)/(9.81" m"."s"^-2)="2.29 s"`.
The time for the ball to return to the same horizontal level as its release point:
`t=2xxt_(up)=2xx"2.29 s"="4.58 s"`.
Question 1
A car is approaching traffic lights. The driver brakes so that the car's velocity decreases from 22 m.s-1 to 7 m.s-1 in a time of 10 s.
a. Sketch a velocity-time graph to represent this section of the car's journey.
b. Calculate the car's acceleration.
c. State how the graph shows that the car is decelerating. Remember that 'decelerating' means that the car's velocity is decreasing; its acceleration is negative.
d. On your graph, shade the area which represents the car's displacement as it is braking.
e. Calculate the displacement of the car.
Question 2
From the graph, deduce the following:
a. The time taken for the car's journey.
b. The distance travelled by the car during its journey.
c. The car's average speed during its journey.
d. The car's greatest speed during its journey.
e. The amount of time the car spent travelling at the speed you calculated in d.
f. The distance it travelled at this speed.
Question 3
Define speed and velocity and distinguish between those two quantities.
Question 4
A car travels due north at a constant speed of 30 m.s−1 for 2.0 minutes. The car then travels due east at a constant speed of 20 m.s−1 for four minutes. What is the total distance travelled by the car?
A. 140 m.
B. 8400 m.
C. 9000 m.
D. 9100 m.
Question 5
A hot-air balloon rises vertically. At time t = 0, a ball is released from the balloon. this graph shows the variation of the ball's velocity v with t. The ball hits the ground at t = 4.1 s.
a. Explain how the graph shows that the acceleration of the ball is constant.
b. Use the graph to:
i. Determine the time at which the ball reaches its highest point.
ii. Show that the ball rises for a further 12 m between release and its highest point.
iii. Determine the distance between the highest point reached by the ball and the ground.
c. The equation relating v and t is v = 15 - 9.81t. State the significance in the equation of:
i. The number of 15.
ii. The negative sign.
Question 6
The variation with time t of the velocity v of two cars P and Q is shown in figure below.The cars travel in the same direction along a straight road. Car P passes car Q at time t = 0.
a. The speed limit for cars on the road is 100 km.h-1. State and explain whether car Q exceeds the speed limit.
b. Calculate the acceleration of car P.
c. Determine the distance between the two cars at time t = 12 s.
Question 7
A car of mass 1500 kg travels along a straight horizontal road.
The variation with time t of the displacement x of the car is shown figure below.a. Calculate the average velocity during the time interval t = 0 to t = 1.5 s.
b. Show that the average acceleration between t = 1.5 s and t = 4.0 s is −7.2 m.s−2.
Question 8
An aircraft flies 30 km due east and then 50 km north-east (figure below). Calculate the final displacement of the aircraft.
Question 9
A ball is thrown vertically upwards with an initial speed of 20 m.s−1 from a platform 15 m above the ground. The ball travels to a maximum height and then returns to ground level. How long does the ball take to travel from the platform to its maximum height and then to the ground?
A. 2.7 s.
B. 4.1 s.
C. 4.7 s.
D. 5.3 s.
Question 10
A ball is thrown at an angle to the horizontal of 30° with an initial speed of 45 m.s−1. What time does the ball take to return to the same horizontal level as its release point?
A. 2.3 s.
B. 4.0 s.
C. 4.6 s.
D. 8.0 s.

