
Question 1
Given the following frequency distribution, find
a) the median;
b) the mean.
Mark as Complete
Mark Scheme
Question 2
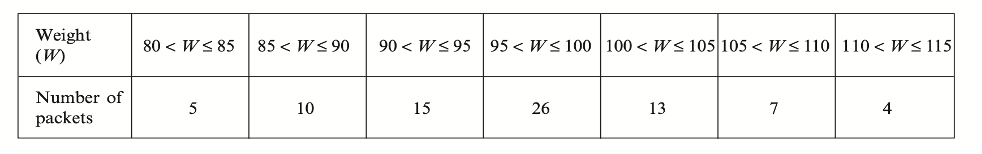
The table below represents the weights, `W`, in grams, of 80 packets of roasted peanuts.
(a) Use the midpoint of each interval to find an estimate for the standard deviation of the weights.
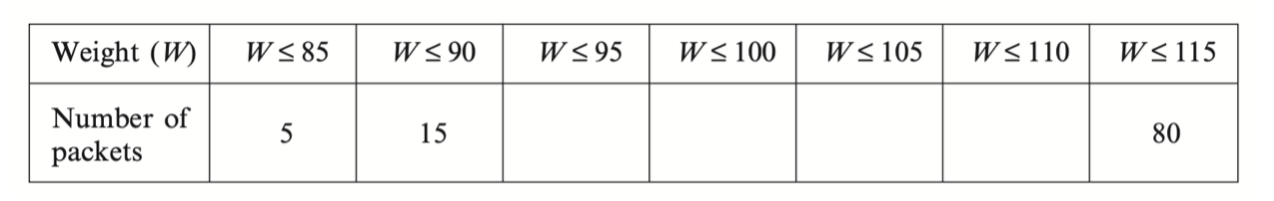
(b) Copy and complete the following cumulative frequency table for the above data.
(c) A cumulative frequency graph of the distribution is shown below, with a scale 2 cm for 10 packets on the vertical axis and 2 cm for 5 grams on the horizontal axis.
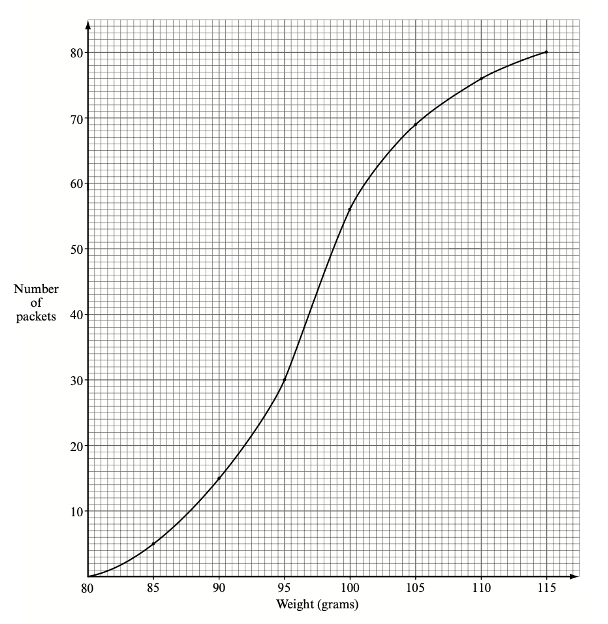
Use the graph to estimate
(i) the median;
(ii) the upper quartile (that is, the third quartile).
Give your answers to the nearest gram.
(d) Let `W_1,W_2,...,W_80` be the individual weights of the packets, and let `\barW` be their mean. What is the value of the sum
`(W_1-\barW)+(W_2-\barW)+(W_3-\barW)+...+(W_79-\barW)+(W_80-\barW)?`
(e) One of the 80 packets is selected at random. Given that its weight satisfies `85 < W <= 110` find the probability that its weight is greater than 100 grams.
Mark as Complete
Mark Scheme
Question 3
A test which is marked out of 100 is written by 800 students. The cumulative frequency graph for the results of the test is given below.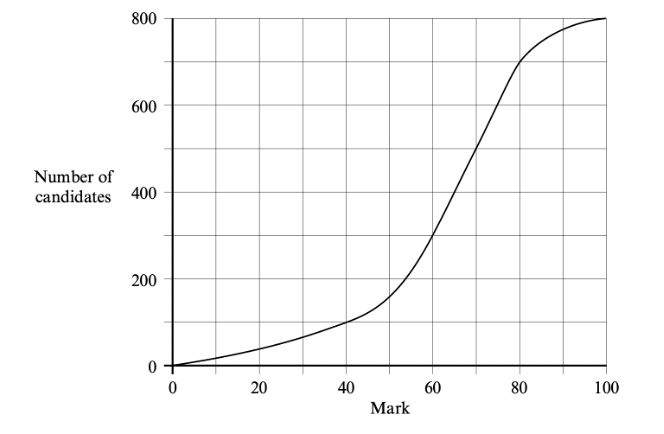
(a) How many students scored 40 marks or less on the test?
(b) The middle 50% of test results lie between the marks `a` and `b`, where `a < b`. Write down the values of `a` and `b`
Mark as Complete
Mark Scheme
Question 4
The population P is the set of numbers `{-3, 3, a, b}`, and has a mean of 0 and a standard deviation of 17. Given that `b > a`, determine the values of `a` and `b`.
Mark as Complete
Mark Scheme
Question 5
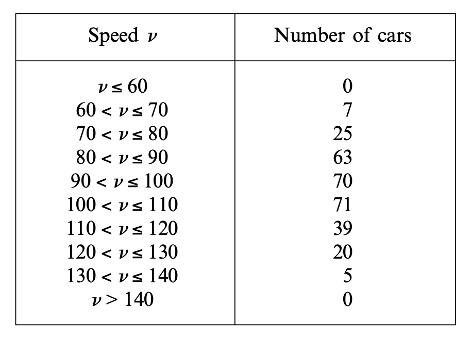
The speeds in km h–1 of cars passing a point on a highway are recorded in the following table.
(a) Calculate an estimate of the mean speed of the cars.
(b) The following table gives some of the cumulative frequencies for the information above.
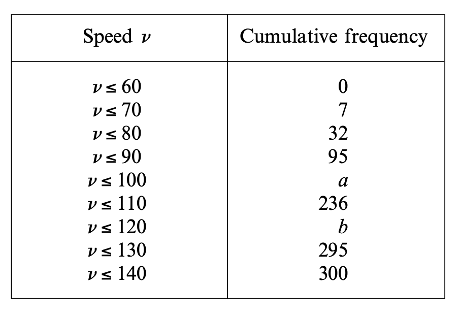
(i) Write down the values of `a` and `b`.
(ii) On graph paper, construct a cumulative frequency curve to represent this information. Use a scale of 1 cm for 10 km h–1 on the horizontal axis and a scale of 1 cm for 20 cars on the vertical axis.
(c) Use your graph to determine
(i) the percentage of cars travelling at a speed in excess of 105 km h–1;
(ii) the speed which is exceeded by 15% of the cars.
Mark as Complete
Mark Scheme
Question 6
The box and whisker diagram shown below represents the marks received by 32 students.
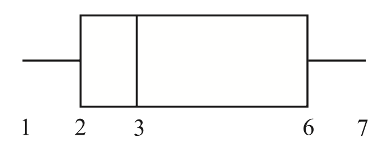
(a) Write down the value of the median mark.
(b) Write down the value of the upper quartile.
(c) Estimate the number of students who received a mark greater than 6.
Mark as Complete
Mark Scheme
Question 7
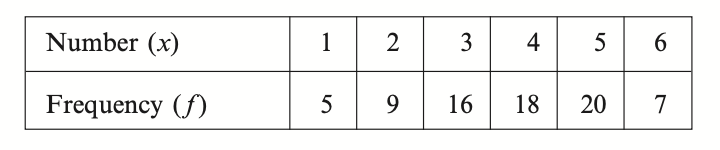
A box contains 100 cards. Each card has a number between one and six written on it. The following table shows the frequencies for each number.
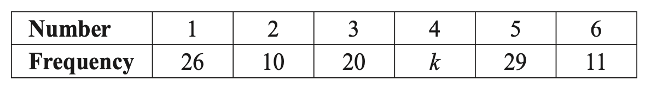
(a) Calculate the value of `k`
(b) Find
(i) the median;
(ii) the interquartile range.
Mark as Complete
Mark Scheme
Question 8
A scientist has 100 female fish and 100 male fish. She measures their lengths to the nearest cm. These are shown in the following box and whisker diagrams.
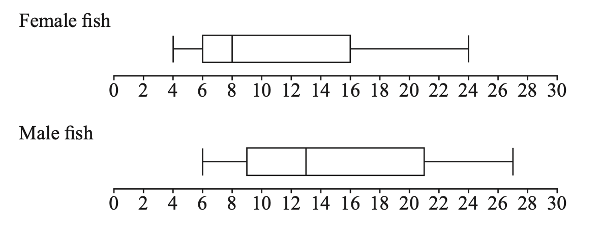
(a) Find the range of the lengths of all 200 fish.
(b) Four cumulative frequency graphs are shown below.
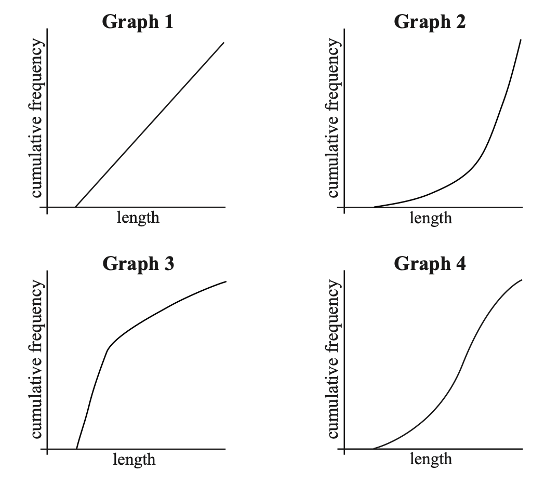
Which graph is the best representation of the lengths of the female fish?
Mark as Complete
Mark Scheme
Question 9
The ages of people attending a music concert are given in the table below.
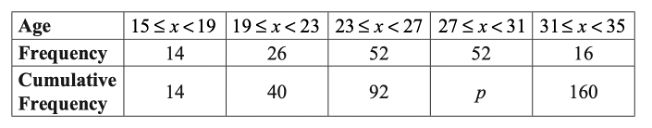
(a) Find `p`
The cumulative frequency diagram is given below.
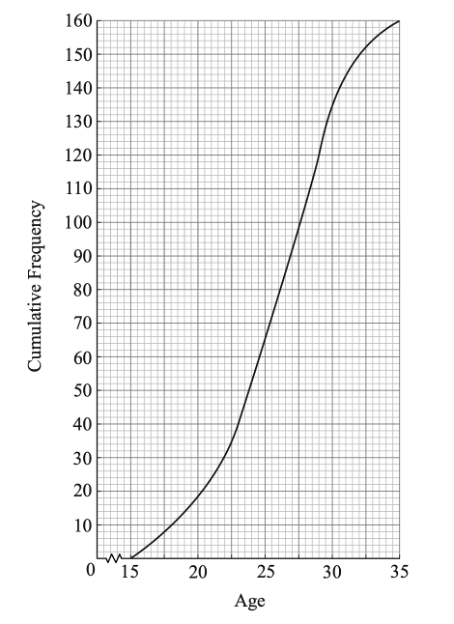
(b) Use the diagram to estimate
(i) the 80th percentile;
(ii) the interquartile range.
Mark as Complete
Mark Scheme
Question 10
A research student weighed lizard eggs in grams and recorded the results. The following box and whisker diagram shows a summary of the results where L and U are the lower and upper quartiles respectively.
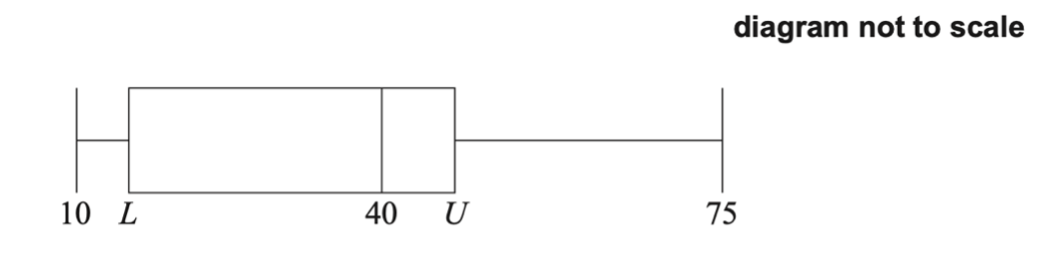 The interquartile range is 20 grams and there are no outliers in the results.
(a) Find the minimum possible value of `U`.
(b) Hence, find the minimum possible value of `L`.
Mark as Complete
Mark Scheme
Question 1
Given the following frequency distribution, find
a) the median;
b) the mean.
(a) Median = middle number of 75
= 38th number
= 4
(b) Mean = `(5 + 18 + 48 + 72 + 100 + 42) / 75`
= `285/75`
= 3.8
Question 2
The table below represents the weights, `W`, in grams, of 80 packets of roasted peanuts.
(a) Use the midpoint of each interval to find an estimate for the standard deviation of the weights.
(b) Copy and complete the following cumulative frequency table for the above data.
(c) A cumulative frequency graph of the distribution is shown below, with a scale 2 cm for 10 packets on the vertical axis and 2 cm for 5 grams on the horizontal axis.
Use the graph to estimate
(i) the median;
(ii) the upper quartile (that is, the third quartile).
Give your answers to the nearest gram.
(d) Let `W_1,W_2,...,W_80` be the individual weights of the packets, and let `\barW` be their mean. What is the value of the sum
`(W_1-\barW)+(W_2-\barW)+(W_3-\barW)+...+(W_79-\barW)+(W_80-\barW)?`
(e) One of the 80 packets is selected at random. Given that its weight satisfies `85 < W <= 110` find the probability that its weight is greater than 100 grams.
(a) s = 7.41 (3 s.f.)
(b)
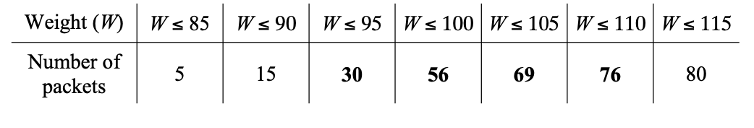
(c)
(i) From the graph, the median is approximately 96.8. Answer: 97 (nearest gram).
(ii) From the graph, the upper or third quartile is approximately 101.2. Answer: 101 (nearest gram).
(d) Sum = 0, since the sum of the deviations from the mean is zero.
(e)
71 packets with weight `85 < W <= 110`
Of these, 20 packets have weight `W>100`
Required probability `= 20/71 = 0.282`
Question 3
A test which is marked out of 100 is written by 800 students. The cumulative frequency graph for the results of the test is given below.
(a) How many students scored 40 marks or less on the test?
(b) The middle 50% of test results lie between the marks `a` and `b`, where `a < b`. Write down the values of `a` and `b`
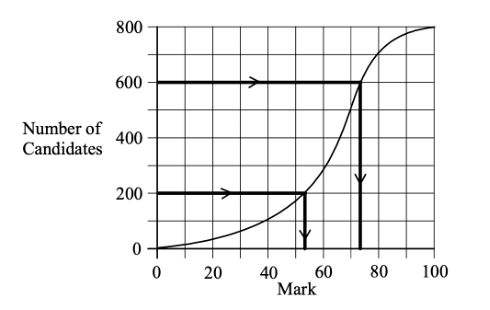
(a) 100 students score 40 marks or fewer.
(b) See graph: `a = 53 (+-1), b = 75 (+-1)`
Question 4
The population P is the set of numbers `{-3, 3, a, b}`, and has a mean of 0 and a standard deviation of 17. Given that `b > a`, determine the values of `a` and `b`.
`(-3 + 3 + a + b)/4 = 0 => a + b = 0`
`((-3)^2 + 3^2 + a^2 + b^2)/4 = 17 => a^2 + b^2 = 68 - 18 = 50`
`a = -b => 2a^2 = 50 => a^2=25`
`b >a => a = -5 and b=5`
Question 5
The speeds in km h–1 of cars passing a point on a highway are recorded in the following table.
(a) Calculate an estimate of the mean speed of the cars.
(b) The following table gives some of the cumulative frequencies for the information above.
(i) Write down the values of `a` and `b`.
(ii) On graph paper, construct a cumulative frequency curve to represent this information. Use a scale of 1 cm for 10 km h–1 on the horizontal axis and a scale of 1 cm for 20 cars on the vertical axis.
(c) Use your graph to determine
(i) the percentage of cars travelling at a speed in excess of 105 km h–1;
(ii) the speed which is exceeded by 15% of the cars.
(a) `bar v = 98.2`
(b)
(i) `a = 165, b = 275`
(ii)
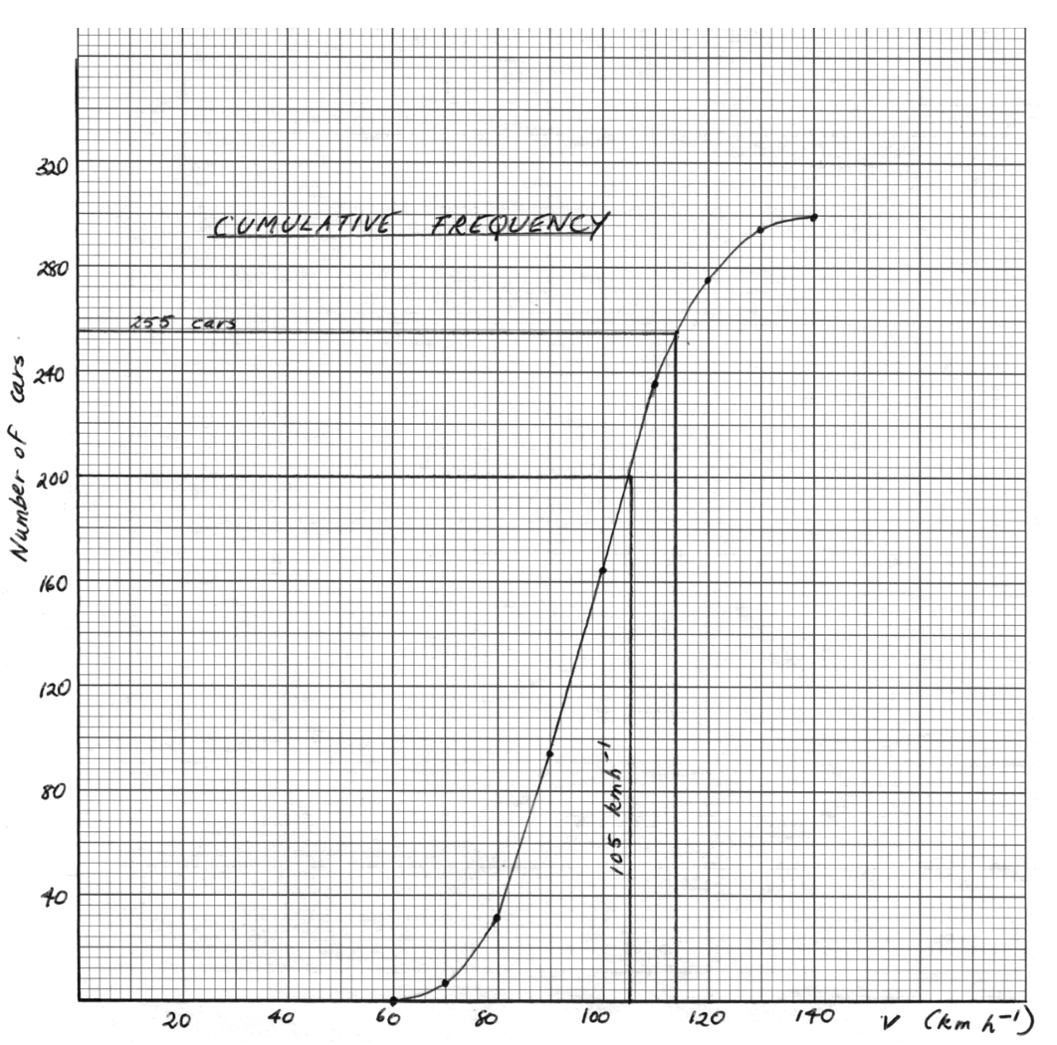
(c)
(i) `33.3 \ (+-1.3%)`
(ii) Speed = 114(±2km h−1)
Question 6
The box and whisker diagram shown below represents the marks received by 32 students.
(a) Write down the value of the median mark.
(b) Write down the value of the upper quartile.
(c) Estimate the number of students who received a mark greater than 6.
(a) 3
(b) 6
(c) Recognising the link between 6 and the upper quantile
e.g. 25% scored greater than 6,
`0.25 \times 32`
8
Question 7
A box contains 100 cards. Each card has a number between one and six written on it. The following table shows the frequencies for each number.
(a) Calculate the value of `k`
(b) Find
(i) the median;
(ii) the interquartile range.
(a) Evidence of using `sum f_i = 100`
`k = 4`
(b)
(i) Evidence of median position
e.g. 50th item, 26 + 10 + 20 = 56
median = 3
(ii) `Q_1 = 1; Q_3 = 5`
interquartile range = 4 (accept 1 to 5 or 5 – 1, etc.)
Question 8
A scientist has 100 female fish and 100 male fish. She measures their lengths to the nearest cm. These are shown in the following box and whisker diagrams.
(a) Find the range of the lengths of all 200 fish.
(b) Four cumulative frequency graphs are shown below.
Which graph is the best representation of the lengths of the female fish?
(a) Correct end points max = 27, min = 4
Range = 23
(b) Graph 3
Question 9
The ages of people attending a music concert are given in the table below.
(a) Find `p`
The cumulative frequency diagram is given below.
(b) Use the diagram to estimate
(i) the 80th percentile;
(ii) the interquartile range.
(a) Evidence of valid approach
e.g. 92 + 52, line on graph at `x = 31`
`p = 144`
(b)
(i) Evidence of valid approach
e.g. line on graph, `0.8 \times 160`, using complement
= 29.5
(ii) `Q_1 = 23, Q_3=29`
IQR = 6 (accept any notation that suggests an interval)
Question 10
A research student weighed lizard eggs in grams and recorded the results. The following box and whisker diagram shows a summary of the results where L and U are the lower and upper quartiles respectively.
The interquartile range is 20 grams and there are no outliers in the results.
(a) Find the minimum possible value of `U`.
(b) Hence, find the minimum possible value of `L`.
(a) Attempt to use the definition of outlier
`1.5 times 20 + Q_3`
`1.5 times 20 + U >=75 \ ( => U >= 45,` accept `U > 45)`
Minimum value of `U = 45`
(b) Attempt to use interquartile range
`U - L = 20` (may be seen in part (a)) OR `L >= 25` (accept `L > 25`)
Minimum value of `L = 25`
Question 1
Given the following frequency distribution, find
a) the median;
b) the mean.
Question 2
The table below represents the weights, `W`, in grams, of 80 packets of roasted peanuts.
(a) Use the midpoint of each interval to find an estimate for the standard deviation of the weights.
(b) Copy and complete the following cumulative frequency table for the above data.
(c) A cumulative frequency graph of the distribution is shown below, with a scale 2 cm for 10 packets on the vertical axis and 2 cm for 5 grams on the horizontal axis.
Use the graph to estimate
(i) the median;
(ii) the upper quartile (that is, the third quartile).
Give your answers to the nearest gram.
(d) Let `W_1,W_2,...,W_80` be the individual weights of the packets, and let `\barW` be their mean. What is the value of the sum
`(W_1-\barW)+(W_2-\barW)+(W_3-\barW)+...+(W_79-\barW)+(W_80-\barW)?`
(e) One of the 80 packets is selected at random. Given that its weight satisfies `85 < W <= 110` find the probability that its weight is greater than 100 grams.
Question 3
A test which is marked out of 100 is written by 800 students. The cumulative frequency graph for the results of the test is given below.
(a) How many students scored 40 marks or less on the test?
(b) The middle 50% of test results lie between the marks `a` and `b`, where `a < b`. Write down the values of `a` and `b`
Question 4
The population P is the set of numbers `{-3, 3, a, b}`, and has a mean of 0 and a standard deviation of 17. Given that `b > a`, determine the values of `a` and `b`.
Question 5
The speeds in km h–1 of cars passing a point on a highway are recorded in the following table.
(a) Calculate an estimate of the mean speed of the cars.
(b) The following table gives some of the cumulative frequencies for the information above.
(i) Write down the values of `a` and `b`.
(ii) On graph paper, construct a cumulative frequency curve to represent this information. Use a scale of 1 cm for 10 km h–1 on the horizontal axis and a scale of 1 cm for 20 cars on the vertical axis.
(c) Use your graph to determine
(i) the percentage of cars travelling at a speed in excess of 105 km h–1;
(ii) the speed which is exceeded by 15% of the cars.
Question 6
The box and whisker diagram shown below represents the marks received by 32 students.
(a) Write down the value of the median mark.
(b) Write down the value of the upper quartile.
(c) Estimate the number of students who received a mark greater than 6.
Question 7
A box contains 100 cards. Each card has a number between one and six written on it. The following table shows the frequencies for each number.
(a) Calculate the value of `k`
(b) Find
(i) the median;
(ii) the interquartile range.
Question 8
A scientist has 100 female fish and 100 male fish. She measures their lengths to the nearest cm. These are shown in the following box and whisker diagrams.
(a) Find the range of the lengths of all 200 fish.
(b) Four cumulative frequency graphs are shown below.
Which graph is the best representation of the lengths of the female fish?
Question 9
The ages of people attending a music concert are given in the table below.
(a) Find `p`
The cumulative frequency diagram is given below.
(b) Use the diagram to estimate
(i) the 80th percentile;
(ii) the interquartile range.
Question 10
A research student weighed lizard eggs in grams and recorded the results. The following box and whisker diagram shows a summary of the results where L and U are the lower and upper quartiles respectively.
The interquartile range is 20 grams and there are no outliers in the results.
(a) Find the minimum possible value of `U`.
(b) Hence, find the minimum possible value of `L`.

